

Report
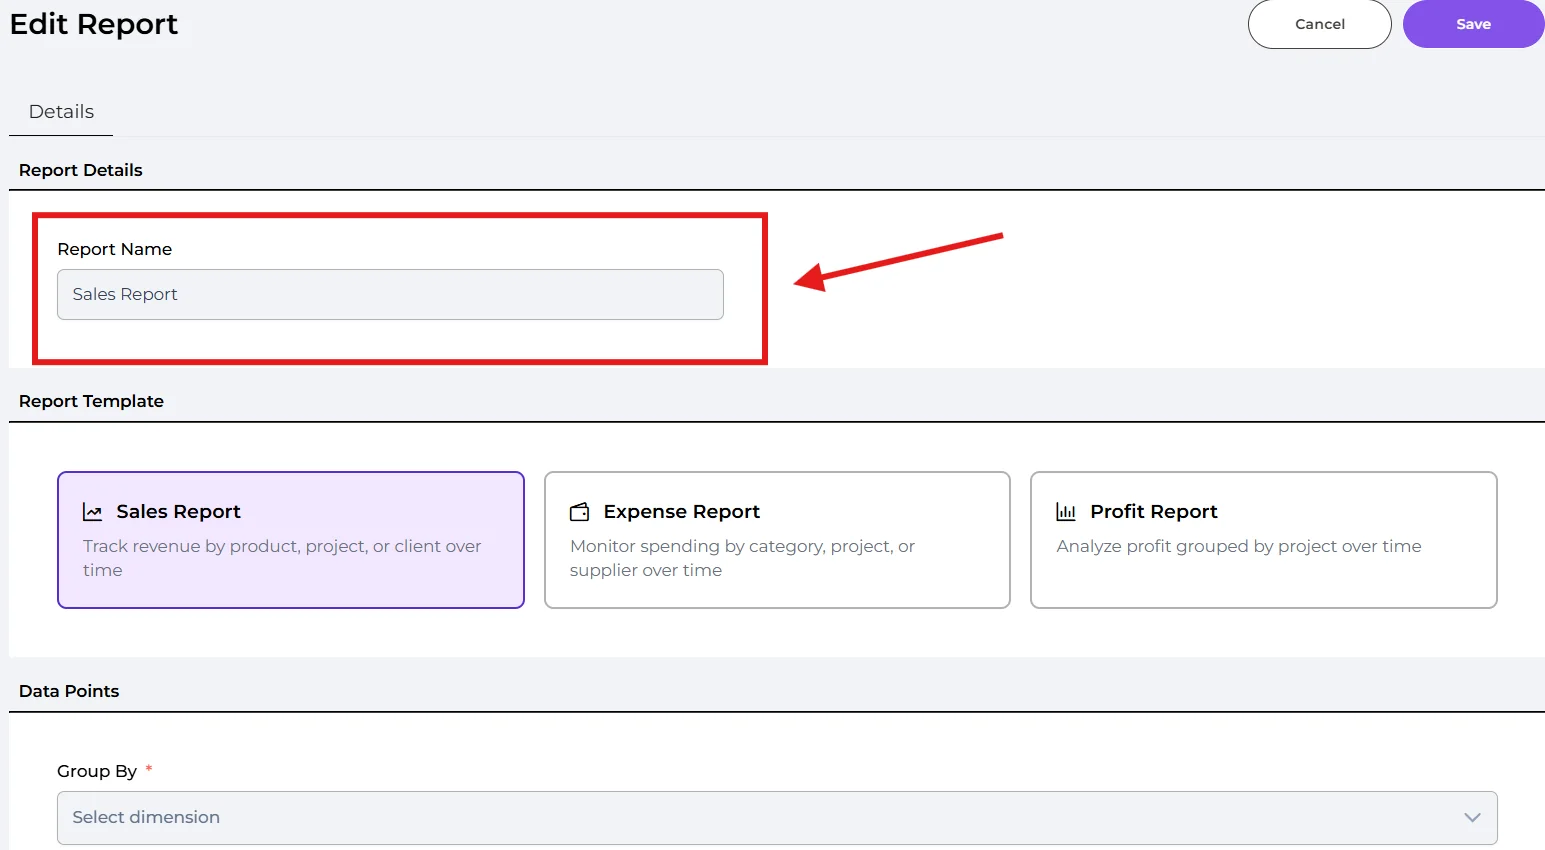
A report is a chart that tracks your Sales, Expenses, or Profit over time. You can build your own reports and arrange them on one dashboard.
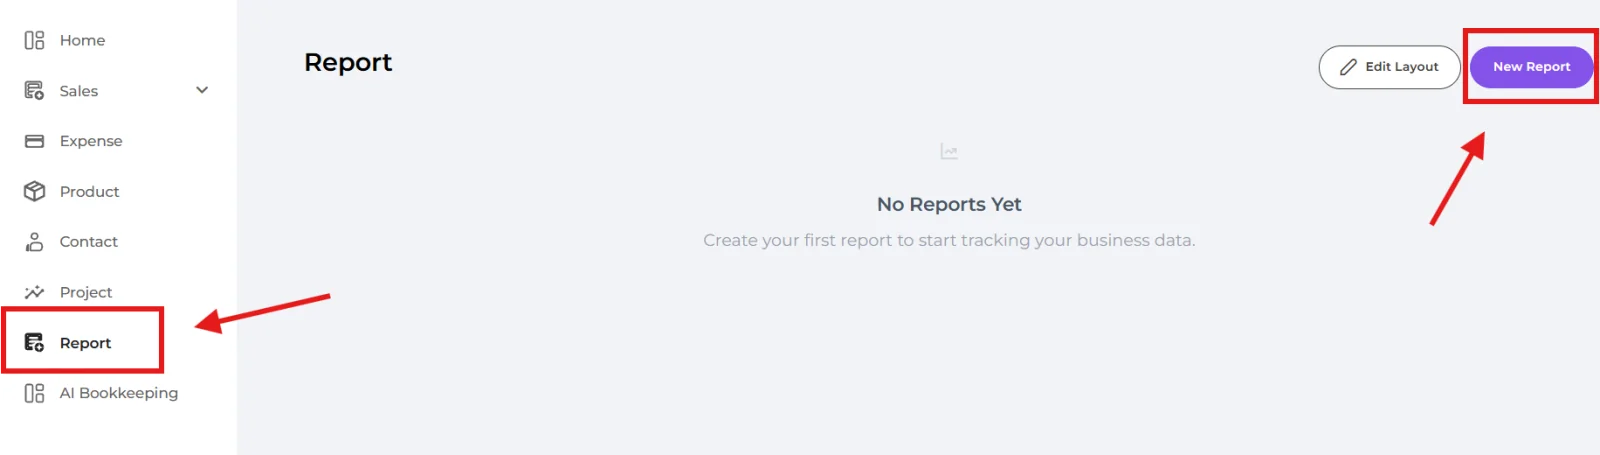
Navigate to Report on the left menu, then click "New Report".
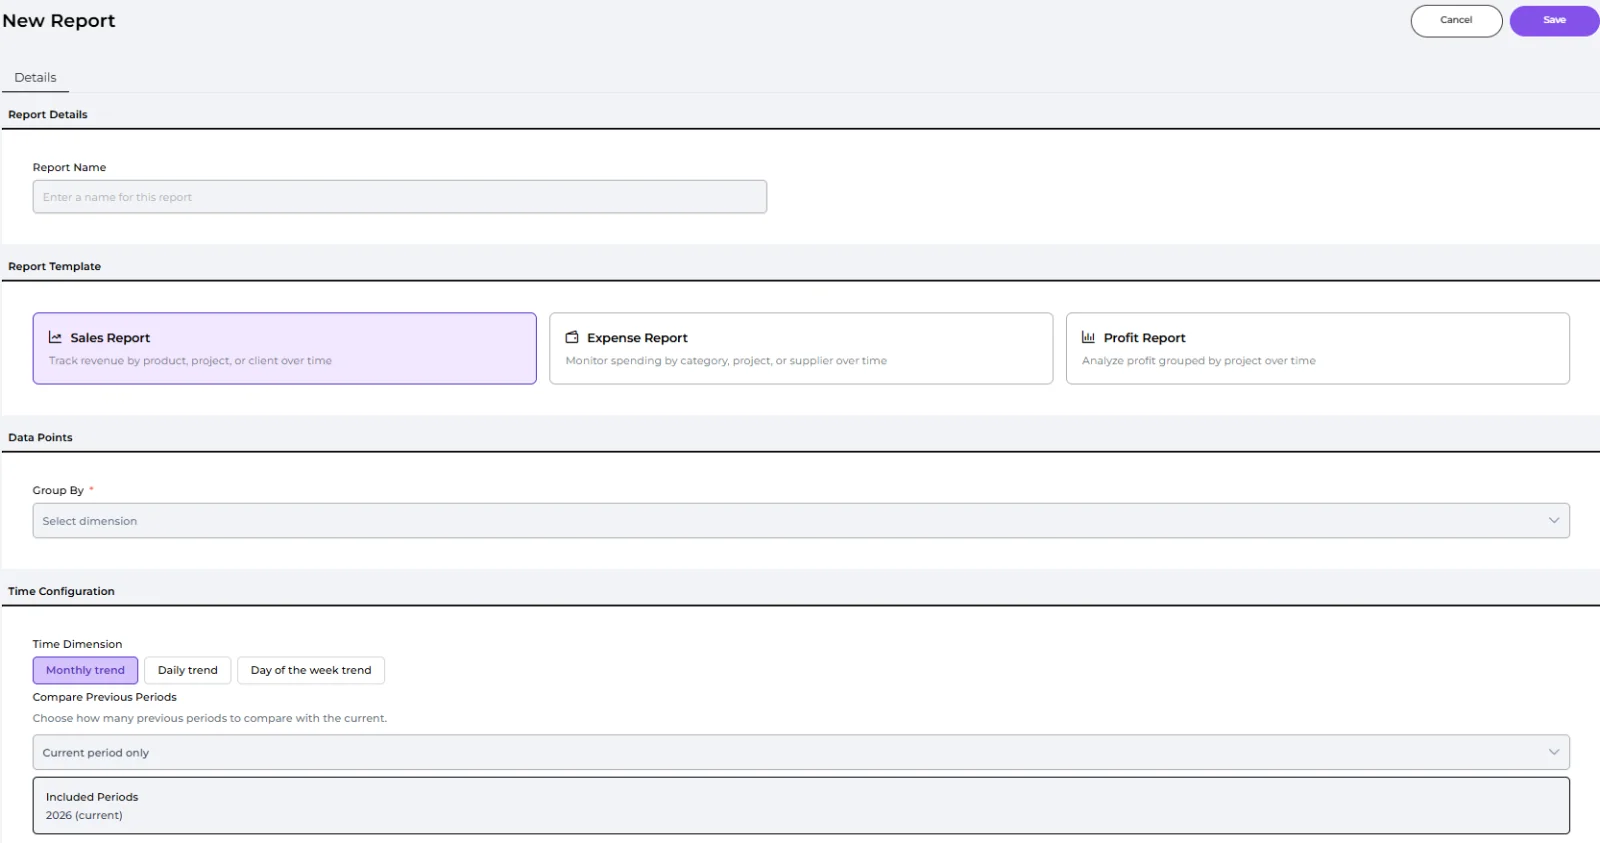
🔹 Sales Report
Track your revenue by product, project, or client.
🔹 Expense Report
Monitor your spending by category, project, or supplier.
🔹 Profit Report
Analyze profit, grouped by project.
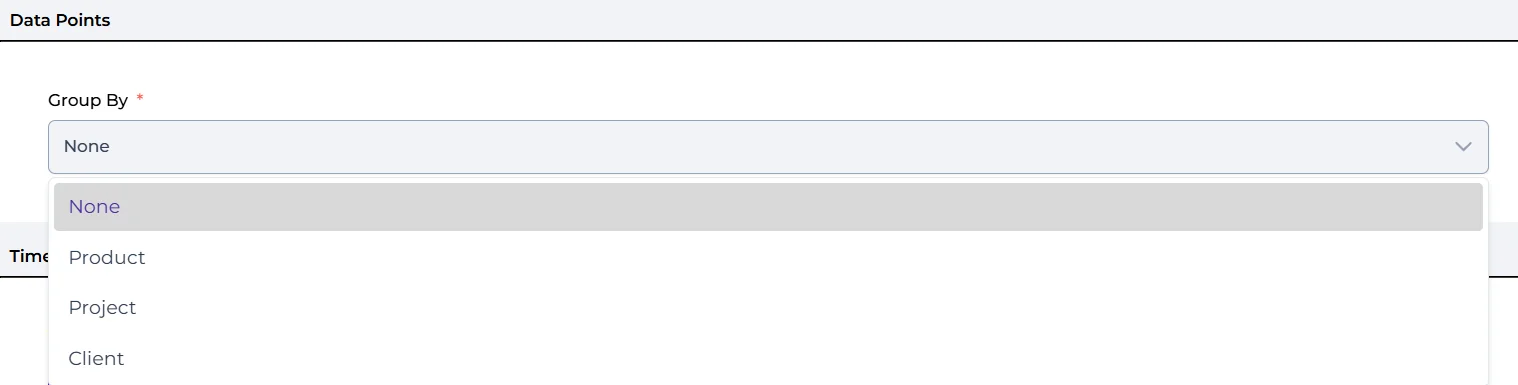
🔹 Group By (Optional)
Choose what to break the chart down (e.g. product, project, client for Sales; category, project, supplier for Expenses; project for Profit).
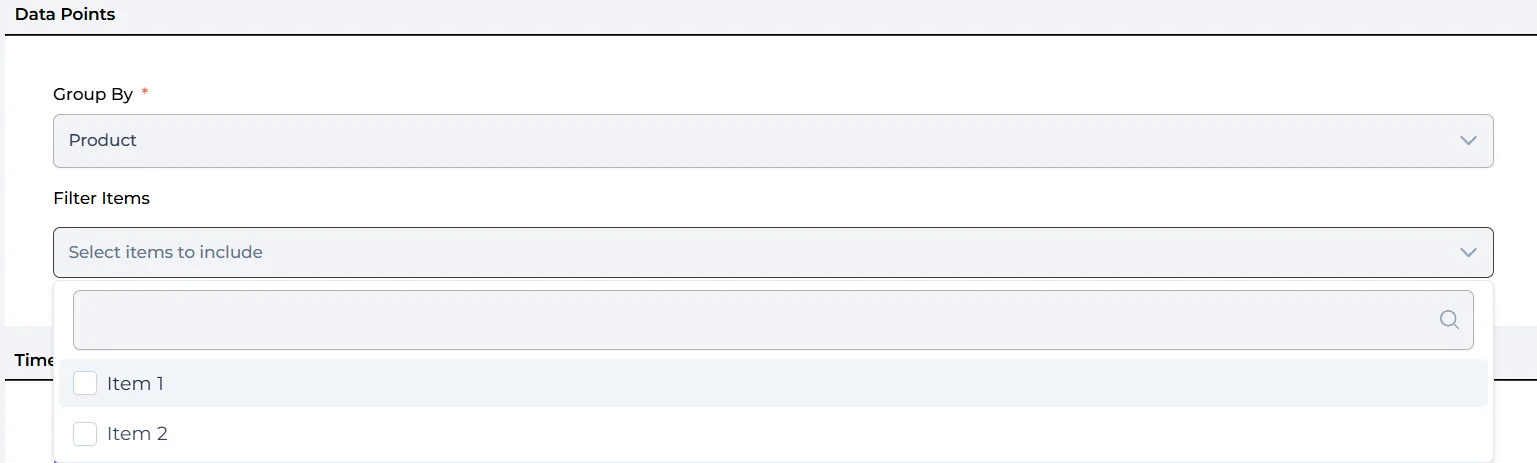
🔹 Filter Items (Optional)
Pick specific items to include (up to 5), or leave empty to include everything.
🔹 Time Dimension
Monthly trend, Daily trend, or Day-of-week trend.
🔹 Compare Previous Periods (Optional)
Compare against up to 5 previous periods (available when no "Group By" is set)
The report name fills in automatically (e.g. "Sales Report") - edit it if you like. You'lee see a live Preview as you configure. Click Save to finish.
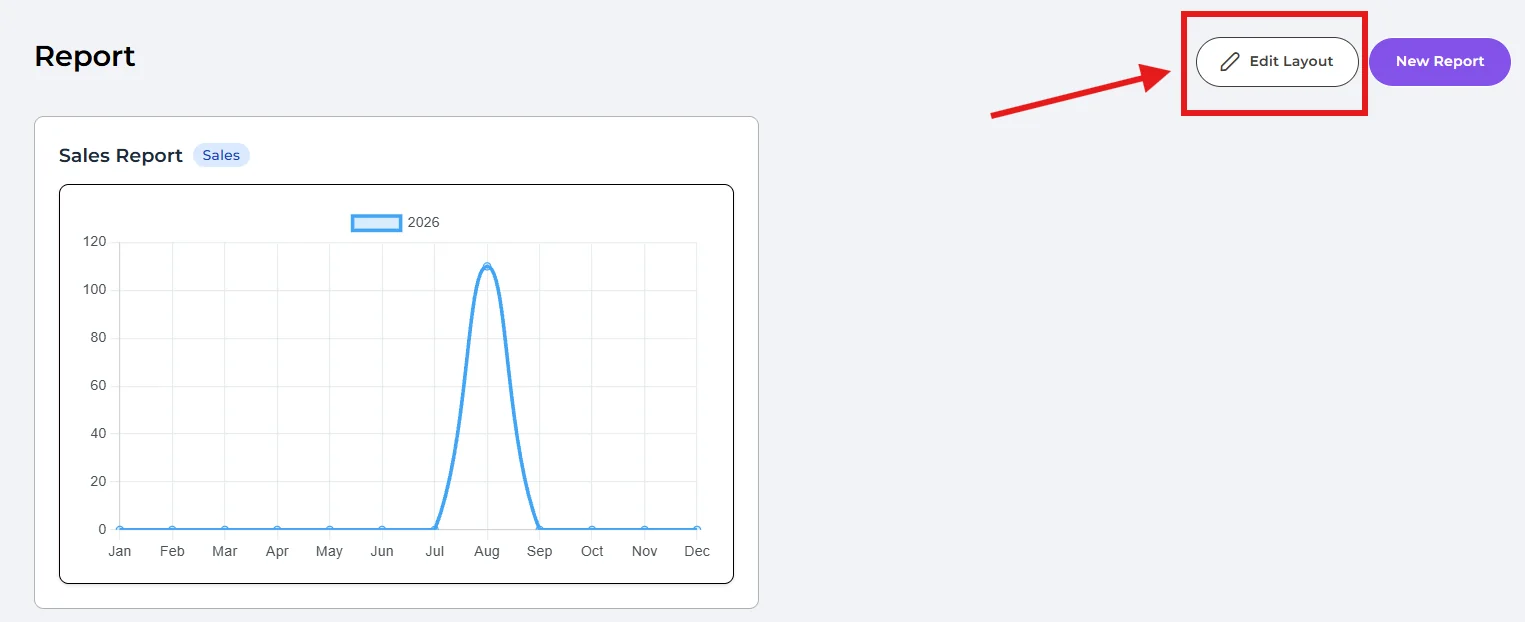
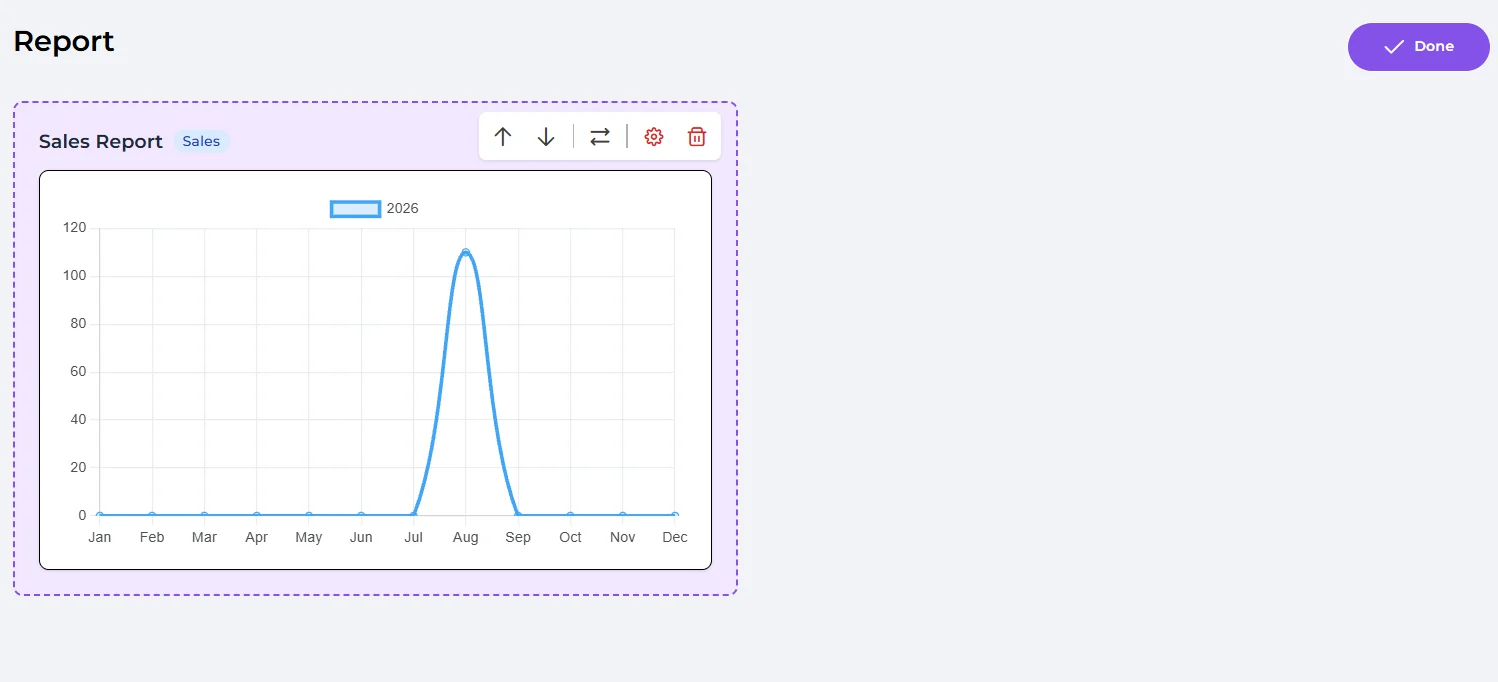
Your reports appear on the Report page. Click "Edit Layout" to move them up/down, resize (expand/shrink), edit, or delete a report.
Well done! You’ve finished this guide.
You can go back to any step at any time.